
Mother ’s Day
In the 17th century British Isles, “Mothering Sunday ”was celebrated on the fourth Sunday in Lent. On this day, servants and apprentices were encouraged to take the day off and … Continue Reading Mother ’s Day
Gray Skies Forever
It ’s no longer just a matter of new technologies and easy-to-use programs. Apparently, what continues to fascinate the most remains the “artisanal ”side of creativity. The artistic flair that is … Continue Reading Gray Skies Forever
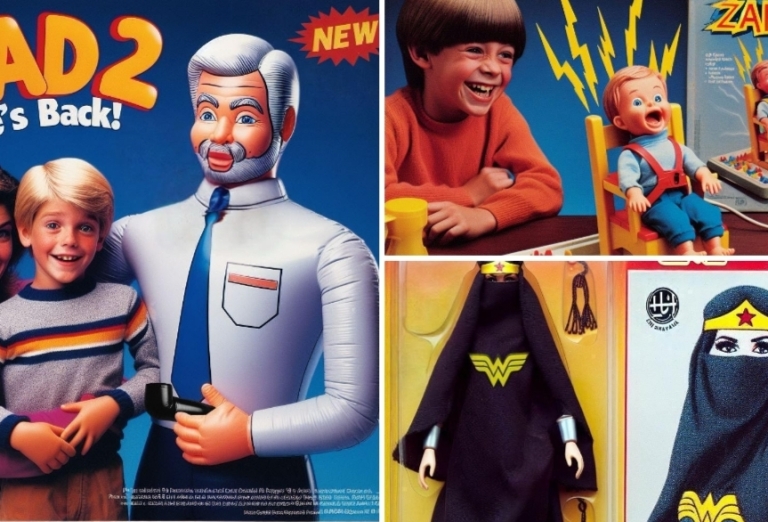
Forbidden Toys
Are you a lover of toys from the 70s, 80s, or 90s, and therefore, today, a sort of nostalgic collector who still loves to waste time socialising, dreaming or joking … Continue Reading Forbidden Toys
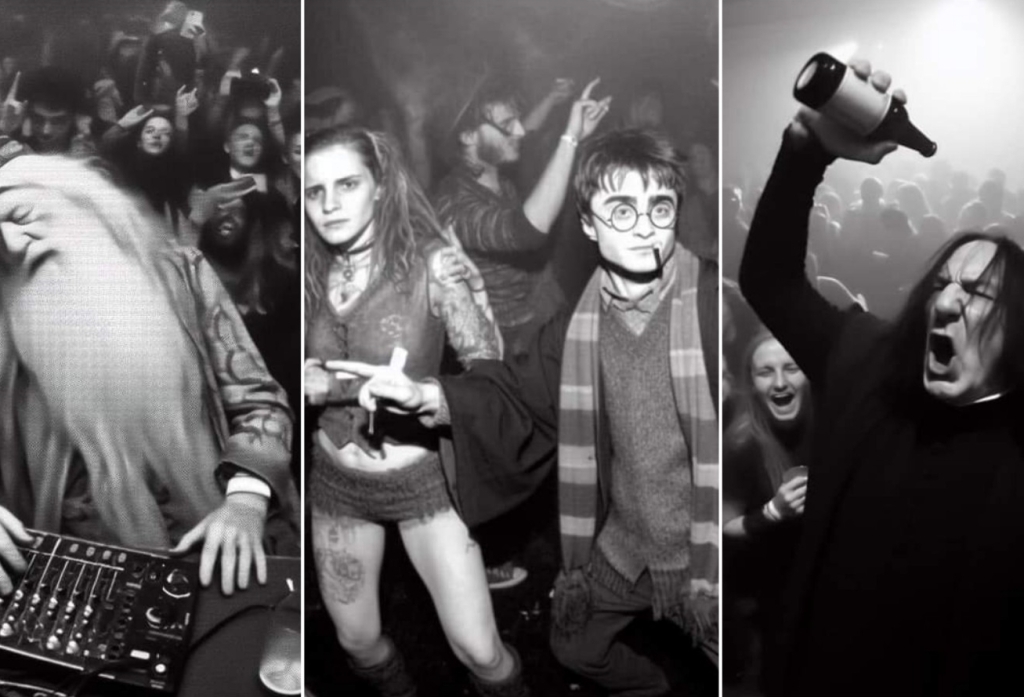
The Great Hogwarts Rave of 1996
I have never been an avid fan of the Harry Potter saga, both the one born from J. K. Rowling ’s mind and read all over the world, and the one … Continue Reading The Great Hogwarts Rave of 1996
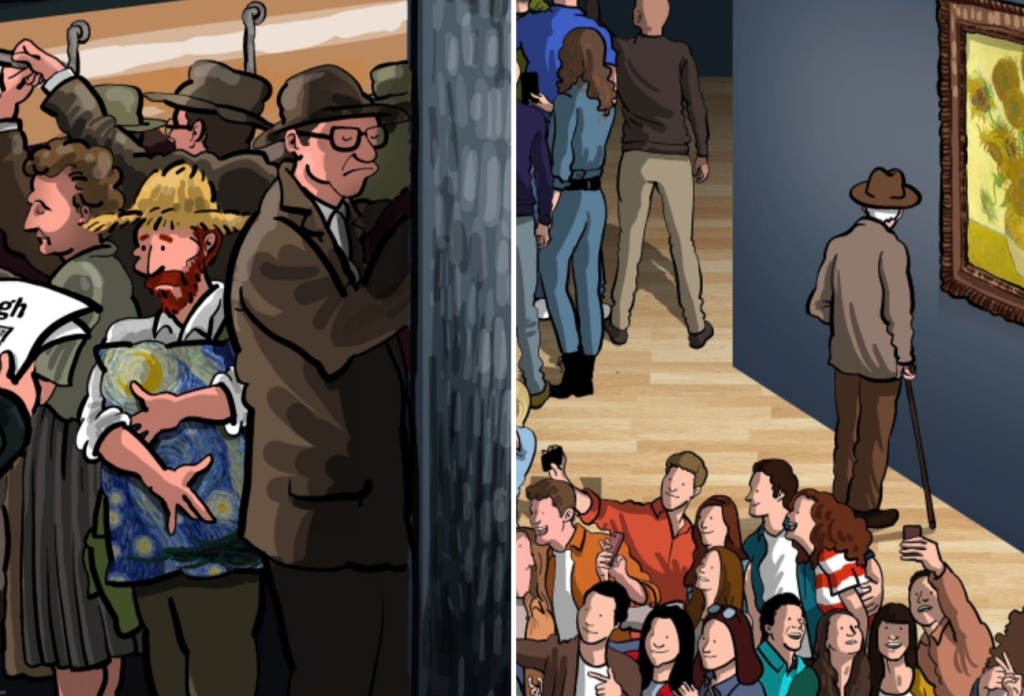
Suicided by Society
Van Gogh did not die from a state of delirium as such, but from having been, in his body, the sphere of a problem in which the iniquitous spirit of … Continue Reading Suicided by Society

Future Is Not Longer the Same
It ’s the title of one of the first series by Anna Bányász, a nature focuser born and lived in Gyergyóújfalu, countryside of Romania. Since her family has a farm, she … Continue Reading Future Is Not Longer the Same
Real Dreams
“Now you can understand me. We camped between the bushes of our heads waiting to fall asleep, to go out and find ourselves in shared dreams. Like someone who tunes … Continue Reading Real Dreams